Fieldnote InstituteFollow the evidence.

Field report / Hydrology

Reading a river in motion.

Every branch of a glacial river carries a record of moving water and sediment. Follow the measurements researchers use to separate a seasonal shift from a lasting change.

Read the field report ↗
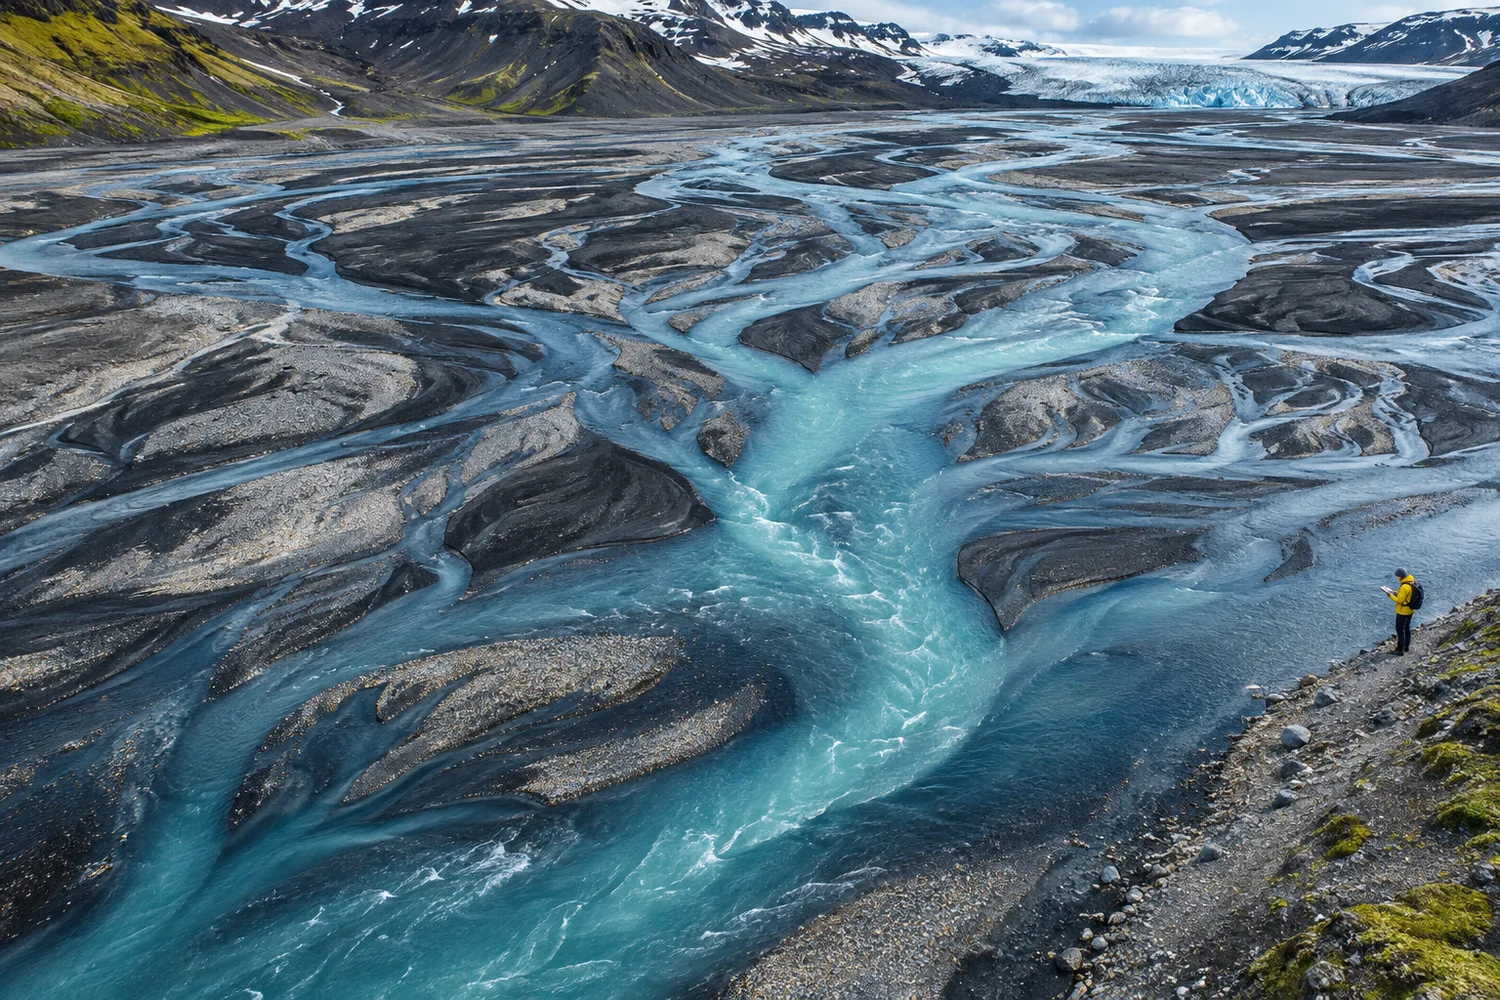
Field illustration · Braided glacial channels viewed from above

Featured research

Measure the same reach twice.

A map captures the river at an instant. The field team returns to the same marked reach over the melt season, recording channel width and water level alongside the time and location of each photograph.

Those repeat observations form the empirical evidence for comparing channel position. Pairing surveys taken at similar water levels helps distinguish a submerged gravel bar from genuine erosion.

Read the methods →
Blue waterways branching across glacial gravel
Aerial images let teams check the same sections on repeat visits.

Lab notes

From measurements to claims.

Calibrating the field kit

Check water-level sensors against a staff gauge before each survey. Log offsets in the same units as the dataset, and document any interval when a sensor was removed or replaced.

Keep the original measurements alongside corrected readings so another team can reproduce the calibration.

Reading the full result

When a paper reports statistical significance, look at the estimated effect and uncertainty interval as well. The size and precision of the estimate help readers judge which conclusions the data support.

In a meta-analysis, review how studies were selected and whether differences in survey methods affect the pooled result.
STEM resources

Find a tool for your question.

Browse the library by topic. The examples use terminology and workflows you can apply to a classroom activity or your own field notes.

3 resources

Fieldwork

Observation log

Record the site, local time, method, units and any equipment changes. Repeat the same sequence at each visit.

Download CSV template ↓

Data literacy

Evidence checklist

Identify the comparison, check the sample size and write down the reported uncertainty. Check whether the conclusion matches what was measured.

Read the lab notes →

Classroom

Sketch a changing river

Draw two channels on tracing paper and stack the sheets. Circle stable reference points and mark where the channels diverge.

Explore the workshop →

Public workshop

Maps in motion.

Bring a sketchbook to a 45-minute session on reading repeat aerial images. We’ll discuss scale, persistent landmarks and how to describe uncertainty in a caption.

Email for the next session and a copy of the classroom worksheet.

Ask about the workshop →

About the institute

Show the work.

Fieldnote Institute is an independent, fictional science publication for readers who want to see how evidence is gathered. We pair explanations with templates and notes you can use yourself.

Educators and field teams can write to propose a topic, suggest a resource or flag an unclear explanation.

Contact the editor →